
Frisco
Elements Massage under new ownership in Frisco
Elements Massage on Main Street is under new ownership.
© 2005-2024 Community Impact Newspaper Co. All rights reserved.
Elements Massage on Main Street is under new ownership.


Show your support for our invaluable journalism with a CI Patron donation.
 Be the reader to give $10 today
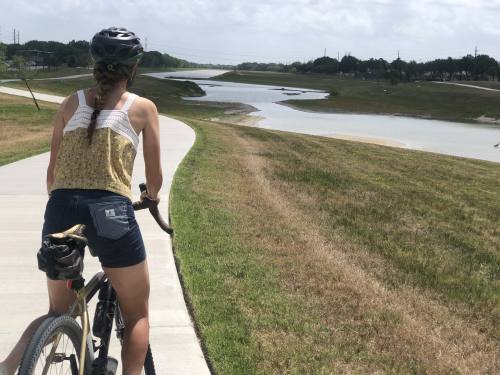
The city of Katy is in the midst of a collaborative effort to construct its parks, trails and recreation master plan. The plan will build on several ongoing parks projects that aim to connect the community and improve the quality of Katy’s parks system, city officials said.


